Industry · E-commerce

Your ROAS is lying.Your bank balance isn’t.

Last month Google and Meta together claimed A$163,347 in sales. The store’s orders screen said A$154,458 — and that’s the number we report, because it’s the one that pays invoices. We run a store of our own, so we know exactly where dashboards lie.
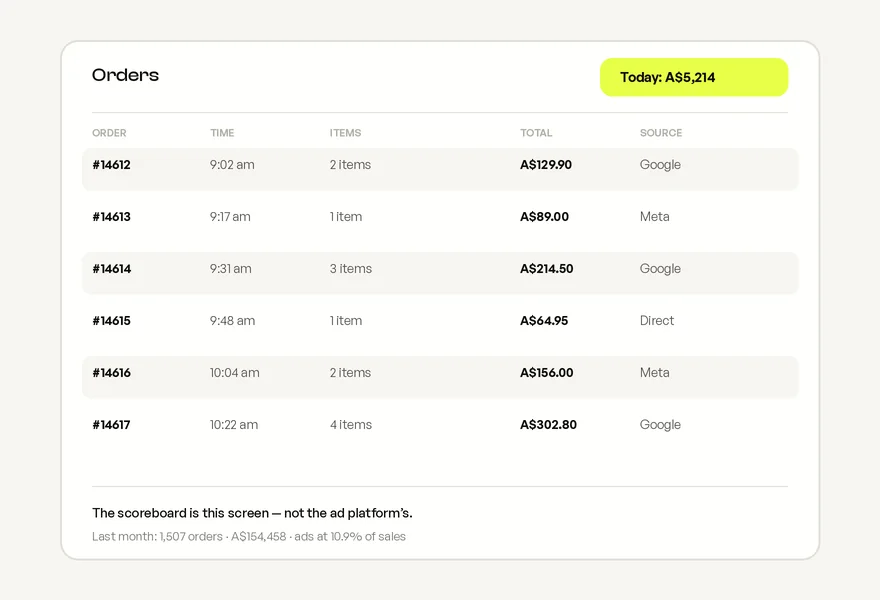
An online store orders screen showing the month’s real totals

Sound familiar?

Every store owner
has lived one of these.

Usually all four. They’re why “great ROAS” stores still run out of cash.

✕
Three platforms, all claiming the same sale.Google says it closed it. Meta says it closed it. Klaviyo takes a bow too. One customer, one order — counted three times in three reports.
✕
ROAS went up. Cash went down.Discount-heavy campaigns, returns nobody subtracts, and double-counted credit. The dashboard can improve while the business gets worse.
✕
You reconcile Shopify at midnight because the agency won’t.Their job ends at the platform report. Ours starts at your orders screen — spend on one line, real sales on the next.
✕
Scaling spend scaled the fee — and nothing else.On a percentage model, “let’s scale” is a raise for the agency. Our fee is fixed, so the only reason we’d say scale is that the numbers do.
→
We judge it where you do: the orders screen.Bring last month’s ad report and your Shopify sales to the call. The gap between them is the first thing we’ll fix.Book the 20 minute call

Proof, not promises

Our own store,
last month.

AXIS runs the advertising for a Melbourne online store it owns. These are its numbers for 23 August to 21 September — from the orders screen, not the ad platform.

SPENTA$16,893Google and Meta together
SALESA$154,4581,507 orders, every source
PER ORDERA$11.21Spend divided by every order
SHARE OF SALES10.9%Eleven cents in every dollar sold

Where we look

The orders screen is the scoreboard.

Spend from the platforms, sales from your store, each order counted once. If Meta claims a sale Google also claims, that’s their argument — your report shows what landed, and what it cost.

  • Real orders, not platform-attributed revenue
  • Returns and discounts in the maths
  • One cost per order across every channel
Get my numbers read straight
A store orders dashboard with daily takings and monthly totals

Before we take a dollar

The maths happens on the first call.

Your average order, your margin, a realistic cost per sale — worked backwards to the spend that makes sense. A$180 product, A$45 target, A$2,700 opening spend. If the maths doesn’t work, we tell you on the call and don’t take the fee.
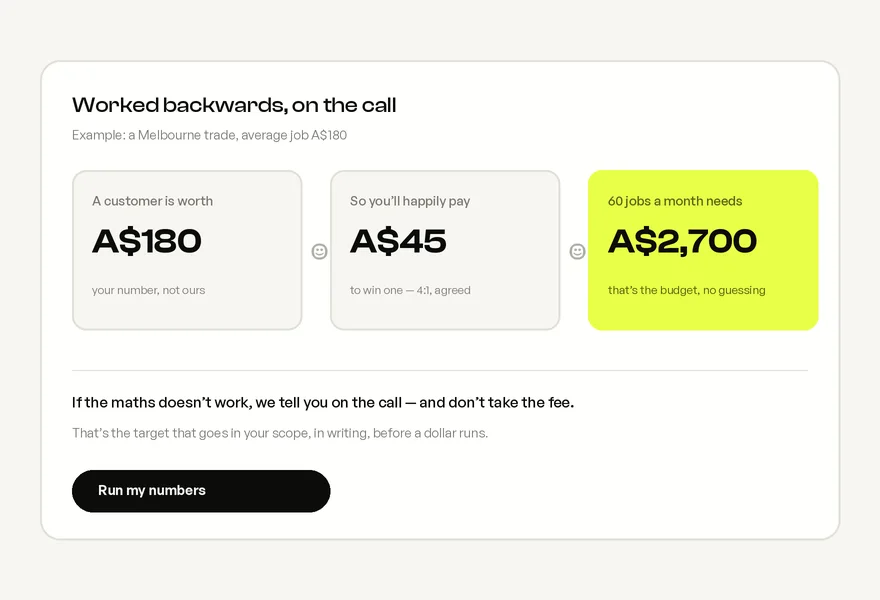
  • Worked backwards from your margin, not forwards from a budget
  • A target cost per sale you sign, not hope for
  • “Ads won’t pay for this” is a real answer we give
Worked-backwards maths from product price to target cost per sale to monthly spend

The first ninety days

What happens,
and when.

Stores don’t need miracles — they need the spend concentrating on what sells.

30

Tracking you can trust

Until the data is clean, everything else is guessing.

  • Pixel and feed fixed and verified
  • Orders reconciled against the store
  • First campaigns live on bestsellers
60

The catalogue sorts itself

Winners get budget. Zombie products stop spending.

  • Creative tested on the top sellers
  • Losing products cut from spend
  • Cost per order trending to target
90

Judged on share of sales

The number our own store runs on: 10.9% last month.

  • Spend as a share of real sales
  • Scale what’s working, in writing
  • Stay or go — month to month

Save yourself a call

Stores we’re built for —
and stores we turn away.

Running our own store made us fussy. The maths has to work for you, or it doesn’t work at all.

A good fit

We’ll likely say yes

Most of these true? The call will end with a target.

  • Average order A$60+ or strong repeat purchase
  • Real margin after shipping and returns
  • Stock to support a good month
  • You’ll judge us on orders, not ROAS screenshots

A bad fit

We’ll say no on the call

We’ve turned these away before. We’ll do it again.

  • Margin that can’t survive any realistic CAC
  • Dropship catalogues with nothing to defend
  • “Scale what my cousin set up” with no tracking
  • You need this month’s ads to pay this month’s rent

What it costs

Fixed price,
GST inside.

Never a percentage of your ad spend. The typed price is the price.

The fee never eats the margin.

A$1,990 a month fixed — about what one mid-level hire costs a week. It doesn’t grow when your spend does, so scaling months are yours to keep.

  • Fixed fee, GST inside, month to month
  • Ad spend from your card straight to the platforms
  • Account, pixel and audiences in your name
Book the call

Before you decide

Asked on the
first call.

The questions owners ask before they hire an agency, answered straight.

It’s real, which is exactly why we reconcile against your orders screen instead of trusting platform attribution. Server-side tracking gets set up where your store supports it, and the monthly report always shows store truth next to platform claims.

No fixed number — the budget falls out of the maths on the call. As a sanity check: if the fee would be more than half your monthly spend, we’ll usually tell you to wait and bank the cash instead.

Only with your sign-off, and only what the ads need — product feed, tracking, landing pages. If the site is what’s broken, we’ll say so and quote it separately rather than letting ads paper over it.

Yes — that’s the point of it. Our own store swings from A$16,664 on its busiest day to A$693 on its quietest. Plans are built around your calendar, and you can wind down in the trough without a penalty clause.

Call or text

Speak to the team

0434 159 894

Melbourne, Victoria. Or send the form and the team replies by phone or email, the same business day.

  • A target cost per sale, in writing
  • A fixed fee, never a cut of your spend
  • Month to month, no lock in

Get your free growth plan

Bring last month’s ad report and your store sales. We’ll explain the gap.

Call 0434 159 894 Message